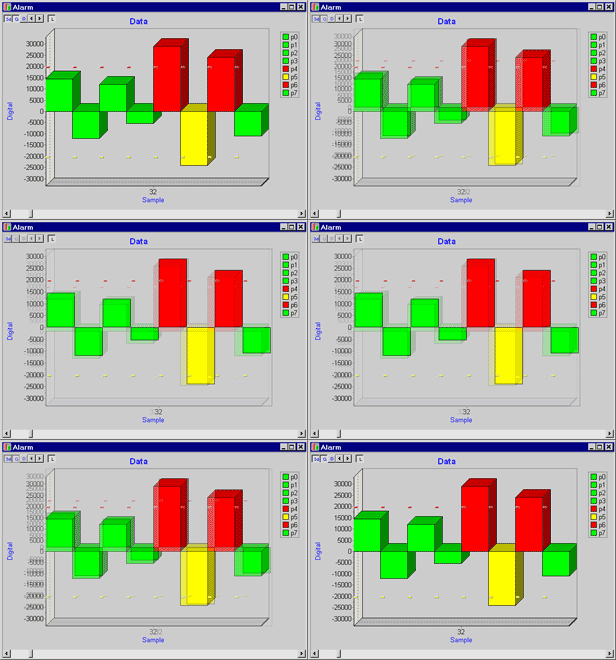
Use the Alarm window for pass/fail testing, process level monitoring, and process range monitoring.
The Alarm window displays graphical representations of data acquired and processed by the DAP board. Customize the display for your requirements. Configurable options include the practical (minimum and/or maximum alarm levels, history length, units/types of measurement) and the visual (3D display, activated alarm colors, background color, titles/captions, channel colors).

Pass/fail example
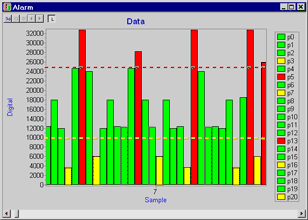
Pass/fail example: On a production line, simultaneously test 32 microphones for proper response to a test tone. An operator can rapidly determine from the display which of the 32 microphones are "out of spec." Excessively high levels show red, insufficient low levels show yellow, and passing microphones display green.

Process level monitoring example
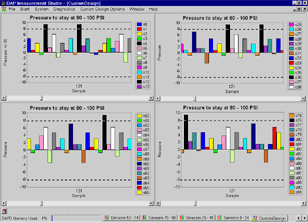
Process level monitoring example (Alarm as display indicator): In an oil refinery with 100 pressure sense points, set up four Alarm windows to display the current pressure in each of the 100 locations (25 locations per window each with a distinct color to allow easy identification of location). An operator can look at the single display to rapidly determine pressure levels in all 100 locations. To have DAPstudio check for proper pressure levels, set up alarm colors for out of bound conditions (over pressure/under pressure).