Long-Run Engine Testing
Fast Sampling, Excellent Accuracy

This article shows how the DAP 5400a and features of Channel Architecture combine to provide an effective and reliable way to capture, process, locally display, and remotely record data from engine tests.
- Engine speeds to 3000 RPM
- Up to eight cylinders measured simultaneously
- Encoder pulses at 1/10 degree rotation
- Pressure sensors in each cylinder
- Timing pulse at top dead center, each rotation
Most applications use the DAP 5400a for capturing measurements on a very large number of signal channels. But when the power of the DAP 5400a is dedicated to just a few channels, it can achieve very fast sampling and excellent accuracy. Under the conditions of this application, the system will collect up to 1.4 million samples per second, a rate that is challenging generally but well within the capacity of a single DAP 5400a. Simultaneous sampling means there is no time-skew between channels.
Test Environment
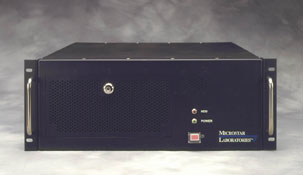
DAPserver 200
The engine test chamber will be a challenging environment for the people and systems running the test. The acquisition system should be built like — well, a truck engine. The DAPserver 200 fits the requirements perfectly, with its rigid stainless steel construction, shock and vibration tolerance, and rack mount for environmental protection. The cabling, terminations, acquisition devices, and local processor node are integrated into one compact package.
The acquisition hardware components for this system:
DAPserver 200 |
This is the package that ties everything together, from signal connectors to local processing. |
DAP 5400a |
The data acquisition engine, it mounts into one of the processor slots. |
MSXB 029 and |
Preserves quality of signals collected from the connector panel and routed to the Data Acquisition Processor. |
MSCBL 040 |
Transfers signals from the analog bus to the DAP 5400a in the processor section. |
Connector panels |
Connector panels on the back of the board rack are ready to attach to your sensor conditioning devices. |
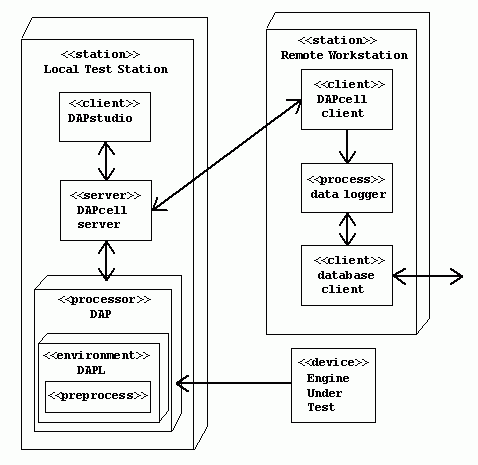
Preview of the Processing Architecture
The following deployment diagram shows how processing is distributed within the test system. Most of the pieces are already fully functional and need only to be configured.
- DAPL system: low level data capture, selection, and transfer
- DAPstudio: DAP configuration, local host display client
- DAPcell: data connections and transfers between stations
- Data logger: custom data analysis and management
- Database client: storage of data records and statistics
Test System Deployment Model
Multiple Time Scales
Measured effects: duration milliseconds. Long-term changes: duration hours or days.
Collecting data at high rates cannot make physical processes happen faster. A Data Acquisition Processor (DAP) board can support multiple time scales, fast enough to capture details at a microscopic resolution, but selective about data retained for logging and display.
We can obtain representative data sets by sampling a 100 cycle set covering all 8 channels. A 100 cycle set takes about 3.3 seconds to collect at top speed.
100 cycles x 7200 samples/cycle x 8 channels
  = 5760000 samples
Test Bed Process Monitoring
What would a test operator need to know about data acquisition during the test?
- Are signals connected?
- Are data captured successfully?
- Do the measurements indicate problems?
Let's presume that there is a video monitor available in the instrumentation rack for live continuous data displays. For purposes of display, a data record of 5760000 samples presents two problems.
- Dealing with bulk. A high resolution screen can show roughly 1000 pixel locations full width. Displaying one row for each cylinder, 7200 points are available per row. The data can be reduced by a factor of 8 to yield 900 points per plot line, with no difference in the graphical displays, but with 87% computation savings.
- Dealing with noise. The measurements contain noisy disturbances. While that accurately characterizes what is happening in the engine, it results in "fuzzy" displays that are hard to interpret.
The following processing performs the data reductions to reduce
the bulk and averaging to reduce the noise. The resulting blocks
of 7200 points are delivered through pipe pAvg8
every few seconds, not interfering with any other processing.
  SKIP(Ip(0..7), 0,8,56, pReduce8);
  BAVERAGE(pReduce8, 7200, 100, pAvg8);
Baseline Data
Human vision is very good at detecting differences if a baseline is presented for comparison. A sample block taken early in the experiment sequence can be used as a visual reference. Processing this data requires no higher-level decisions, and is conveniently combined with other low-level processing within in the DAPL system.
The FREEZE command is a simple extension,
available at no cost if you request it, for download to the DAPL
system. When the command FREEZE observes a change
in its service requeset variable, it clears that variable and
loads the current 7200-sample record into its internal buffer.
After that, it supplies copies of the stored data.
Here is the configuration to tell the DAPL system to send the local host both current data and baseline data.
  FREEZE(pAvg8, vMemorize, 7200, pBaseline8)
  BMERGE(pAvg8, pBaseline8, 7200, $BinOut)
No custom software is required for data management at the
local test station. DAPstudio can be used to start the data
acquisition configuration and provide the local data displays.
DAPstudio will receive display data through the default
$BinOut communication pipe, but will not interfere
with the communication pipes set up for the remote workstation.
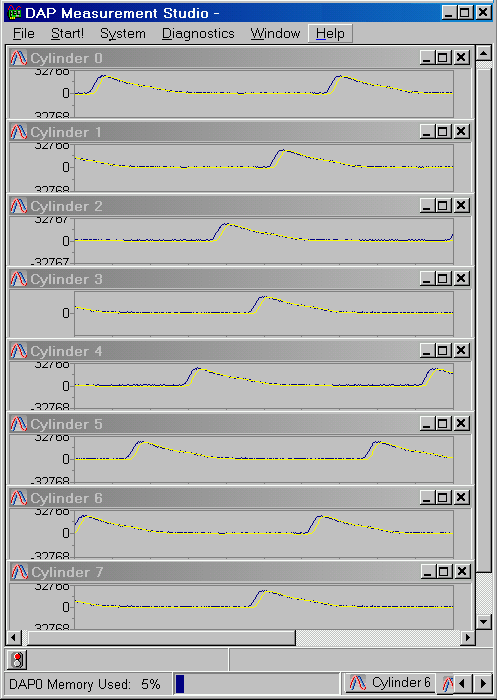
As DAPstudio displays data on the local host, wait for engine operation to stabilize. Then you can perform the following one-time set-up steps to select baseline data for the displays.
- Expand the Configuration window to make it visible.
- Select the
Interpretertab. - Click the
Hide/Showbutton at the upper right. - In the command box at the left, type the command:
LET vMemorize = 1 - Click the
Sendbutton. - Reduce the Configuration window to restore the running data displays.
Current data are overlaid on the baseline
data for each cylinder,
making changes easy to detect.
Selecting Data for Logging
Suppose a test sequence take 2 weeks to complete. That's:
14 days x 24 hours x 60 minutes x 60 seconds
With data sets of 5.76 million 16-bit (2-byte) values captured every 3.333 seconds, that totals roughly 4.18 terrabytes of data. Good luck passing this data through your network and logging it all successfully. Good luck locating the data you need to analyze in that bulk.
|
We will apply these requirement to reduce the raw data storage to a manageable 2.32 gigabytes while retaining all needed information. The test monitoring workstation makes the decisions; the data acquisition provides the sample sets on request, when they are needed. |
Independent Logger Time Base
What should the data analysis workstation do if...
- ...data are needed for logging while the data acquisition is in the middle of capturing a data block?
- ...the engine is running 0.28% under nominal speed so that fewer samples are collected than expected?
Well, it shouldn't do anything. The remote workstation should not be the servant to a data acquisition board. When the workstation wants data, the data acquisition processing should supply it.
To get this kind of timing independence, you can use the
MRBLOCK command, another special processing command
available from Microstar Laboratories on request.
MRBLOCK preserves the Most
Recent BLOCK of data in
its buffer memory. When you ask for data, you get it instantly.
Sampling or other low-level processing will never interfere.
MRBLOCK(Ip(0..7), $CpIn3, 5760000, $CpOut4)
Collecting Data at the Remote Workstation
This is a difficult problem. But you will never know it when you use DAPcell software for data transfers.
The remote workstation sends a block request when it
is ready, to initiate the transfer. The DAPcell software routes
the requests. The data transfers (from MRBLOCK)
begin immediately. The workstation can accept the data and apply
all of the analysis and database update operations at its own
pace. The code to do this will look something like the
following:
' Perform a data block transfer on timer
Private Sub Timer1_Timer( )
    Dim lNumBytesRead As Long
    Dim iRequest As Integer
    lCycleCount = lCycleCount + 1

    ' Open connection to DAP
    hdapBinPut = DapHandleOpen("\\TESTPC\DAP0\$Cp2In", DAPOPEN_WRITE)
    hdapBinGet = DapHandleOpen("\\TESTPC\DAP0\$Cp2Out",DAPOPEN_READ)

    ' Send request for transfer
    iRequest = 1
    DapInt16Put(hdapBinPut,iRequest)

    ' Receive 100 blocks of 57600 sample values
    For iBlock = 1 To 100
        lNumBytesRead = DapBufferGetEx(hdapBinGet, BufGetEx, iData(0))
        If  lNumBytesRead < 0  Then
            MsgBox "Process fault -- no data acquired."
            DapTerminate
            Timer1.Enabled = False
        Else
            ProcessDataBlock(iBlock, lCycleCount, iData(0))
        End If
    End For

    ' Release network connection
    DapHandleClose(hdapBinPut)
    DapHandleClose(hdapBinGet)
End Sub
Conclusions
There are a lot of details about the data acquisition processing that were not discussed. That is not entirely accidental. With intelligent integration through Channel Architecture, those details are covered automatically, so discussion is not necessary.
The Data Acquisition Processor board provides the fast and accurate sampling. The DAPL system takes care of low-level converter hardware control, and supports all of the low level signal conditioning and number crunching processes. Channel Architecture maintains signal quality from end to end, from sample timing, conversion, buffering, networking, all the way through to programming interface application. The DAPcell software provides the service hooks so that applications can access data streams at any time. The DAPIO programming interface provides simple functions for high-level data transfers. The DAPstudio application provides basic functionality for data displays at the local test station without programming.
The combination works together by design. It is rugged, reliable, and intended for long-term continuous operation. It's a great combination for engine test applications.
Return to the Integrated Systems page.